|
For a general introduction of SEEK, please visit the FAQ page.
This page provides guidelines and tips for interpreting the user's search results.
- How to evaluate the quality of the search results?
- Use the Gene Enrichment function to evaluate the coexpressed genes. SEEK chooses the widely used GO biological process gene-sets as gold standard for the evaluation of coexpressed genes.
Using the top R number of genes, users can examine enrichments in biological processes, as well as KEGG pathways, MsigDB (GSEA) gene sets.
By default, it will try to look for enrichment within the top 100 genes. However, it is possible that such enrichment may exist beyond top 100 genes (up to 500 genes). 500 genes represent approximately 2.9% (or 17K genes) of human genome ranked by SEEK, so at this depth we may get significant coexpression.
Use the gene enrichment module to adjust these settings.
Note that a lack of enrichments beyond 500 genes likely means that the retrieved coexpressed genes are highly heterogeneous, possibly resulted by a heterogeneously expressed query. In this case, refinement of user's query is recommended.
The SEEK publication has done systematic gene retrieval evaluations for over 995 different GO biological processes. (see publication)
In general, the higher the enrichment score, the better is the biolgical signal within the coexpressed genes (and so can be said about your query genes, due to the guilt-by-association principle).
SEEK allows users to highlight which coexpressed genes overlapped with a given process' gene-set annotations:

Figure 1: Gene enrichment. Show overlapped GO biological process genes.
-
Use the Dataset Enrichment function to check for over-representation of tissue or disease categories among top datasets prioritized by SEEK given query.
Since every dataset is associated with some tissue/disease (noncancer, cancer) terms, by checking for dataset-set enrichment, users can notice overrepresentations in these categories.
Note that if tissue categories were selected, this is especially useful for prioritizing between tissues based on a gene-set of interest.
One potential drawback is that these dataset categories may not fully capture the full spectrum of experimental conditions, as concepts such as tissue and disease terms may be general. So if users wish to be specific, it is recommended that they read the description of each prioritized dataset to fully evaluate its relevance.
A nice feature of SEEK is that it gives prioritization of all 5000 datasets given query genes, based on which exhibits significant coexpression. Users can check from this list where an interested dataset is ranked relative to query, or in more unbiased way what are all top datasets.
-
Use a clustering based evaluation - in order to assess coexpression relationships between query genes, clustering (or correlation) based measures are defined to individually evaluate datasets. If query genes are strongly clustered more so than random groups of genes in each dataset, this indicates that relevant biological processes are active and dataset is relevant.
This mode is good for users who prefer a quantitative measure of evaluation.
SEEK provides coexpression P-values for all datasets in the compendium. The measure is based on rank-biased version of Pearson correlation (see publication, referred to as the "dataset weight")
The clustering of genes offers a lot of information about the heterogeneity of query gene-set in the cancer samples.
See below for examples of different degree of coexpression (ranging from most coherent, to slighly incoherent, to heterogeneous). SEEK calculates, and furthermore allows you to visualize how query genes are coexpressed with each other in the Expression Viewer. With this viewer, we can intuitively interpret large queries (with over 10 query genes) where it is impossible to know what coexpressed groups may be formed within a large query (Figures 2,3,4).
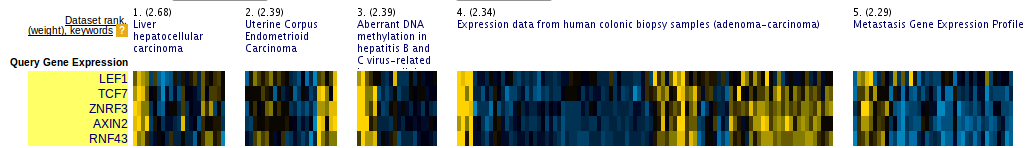 Figure 2: Coherent query. Perfect case.
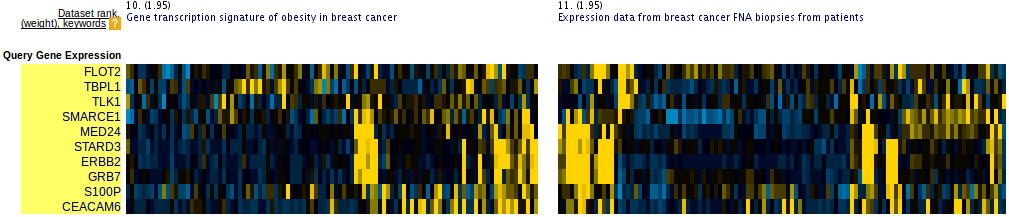 Figure 3: Slightly incoherent query. Prioritized datasets identify few outlier genes.
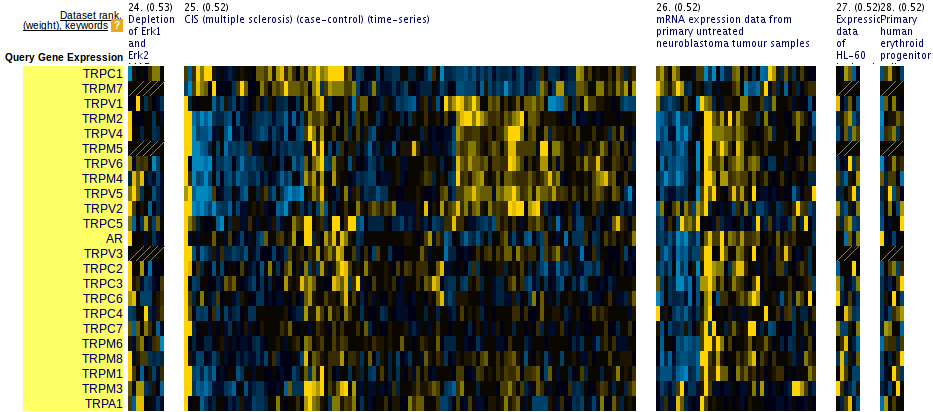 Figure 4: Two-group coherent query. Prioritized datasets find a local clustering pattern. Suggests ways to split the query.
Tip: to see individual dataset's coexpression P-value, click on the link See the complete dataset-list ranked by query-relevance below the result page.
- How do I improve the results?
If you get a weak result after evaluating with the above methods, what can you do to improve your results?
-
Refining datasets
Perhaps you notice that the all-dataset search mode does not work very well for your query. In this case, try refining to a tissue or disease of interest.
(Note that Quick Refine is available for most of the common selected tissues).
You prefer the wide-reach of all-dataset mode but still wish to refine by cancer or noncancer. The solution would be to refine by cancer or non-cancer datasets (highly general categories each contains over 2000 datasets; we highly recommend these two categories).
You don't know which tissue to refine to, because you don't know which tissues they are expressed in. We suggest using multi-tissue profiling search mode (in Quick Refine or Refine Search) to first check which tissue your query is expressed (this works for both single gene and multi-gene query).
You reviewed the top ranked datasets and found some interesting datasets. You can maually select individual datasets to interogate with the Refine Search.
-
Refining query
Small query - (<3 genes). Small query sometimes may not allow SEEK to accurately prioritize datasets. In this case, we suggest expanding your query with functionally related genes (such as those that physically interact with the query). This may improve the result. Use STRING, IMP to get these genes.
Along this line, another popular approach is to add tissue or disease specific genes to your query with the help of multi-tissue profiling search mode in SEEK.
Large query - use visualization based evaluation discussed above to filter your query to a coexpressed subset.
|
|